
The graduation rate indicator is one of four indicators used in Maine’s Model of School Support. It will be used as an indicator of success for high schools only. Graduation is defined as graduating within four years after entering ninth grade. In Maine, the graduation rate indicator reflects the number of students graduating “on-time”, as well as the graduating students who progressed at a different rate and graduated in either five or six years.
In the past, graduation rate was never utilized when making determinations of schools eligible to receive support. Under Maine’s Model of School Support, the graduation rate for students meeting graduation requirements in four years in addition to the graduation rate of students meeting graduation requirements in five or six years will be utilized.

What does this look like in Maine?
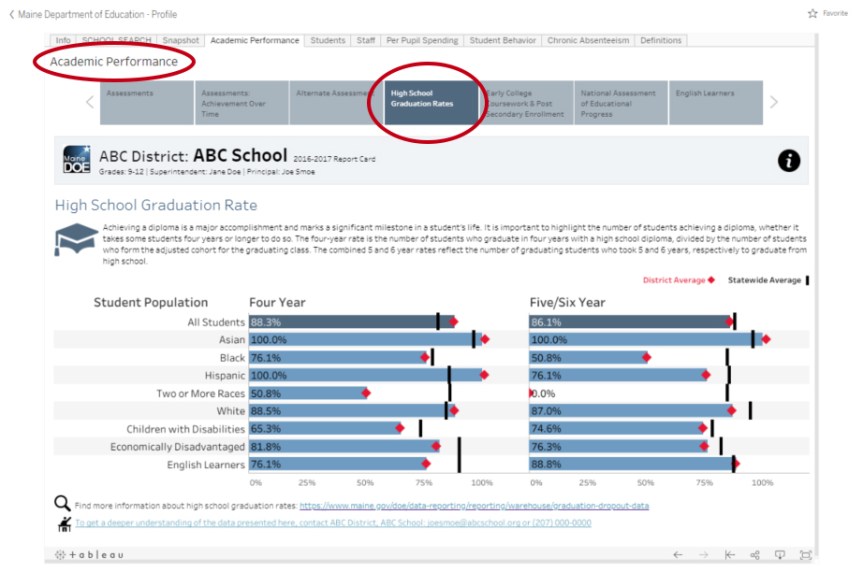
Achieving a diploma is a major accomplishment and marks a significant milestone in a student’s life. It is important to highlight the number of students achieving a diploma, whether it takes some students four years or longer to do so. As it relates to Maine’s Model of School Support, the Graduation Rate indicator is split into two rates of graduation:
-

5 and 6 Year Graduation Rate The 4-year rate is the number of students who graduate in four years with a high school diploma, divided by the number of students who form the adjusted cohort for the graduating class.
- The 5 and 6 year rates reflect the number of graduating students who took 5 and 6 years, respectively to graduate from high school.
How will graduation rate data be presented on the school report card?
The school as a whole will receive a performance measure related to individual student groups meeting the annual graduation target.
Graduation Performance Descriptors:
Graduation – 4 Year
| Emerging | Developing | Meeting | Excelling |
| No eligible student group made their annual graduation target | At least one eligible student group made their annual graduation target | All eligible student groups made their annual graduation target | All eligible student groups have met or exceeded the long-term goal of 90% |
Graduation – Combined 5/6 Year
| Emerging | Developing | Meeting | Excelling |
| No eligible student group made their annual graduation target | At least one eligible student group made their annual graduation target | All eligible student groups made their annual graduation target | All eligible student groups have met or exceeded the long-term goal of 92% |
Eligible student groups include: Asian, Black, Hispanic/Latino, Two or More Races, White, Students with Disabilities, Economically Disadvantaged, Migrant Students, and English Learners.
Goals for four year adjusted cohort graduation rate:
| Subgroup | Baseline (Data and Year) | Long-term Goal (Data and Year) 2030 |
| All students | 86.83% 2016 | 90% or maintain current 2016, whichever is greater, graduation percentages by 2030 |
| Economically disadvantaged students | 77.77% 2016 | |
| Children with disabilities | 72.19% 2016 | |
| English learners | 78.14% 2016 | |
| Race – Hispanic/Latino | 83.46% 2016 | |
| Race – American Indian | 84.91% 2016 | |
| Race – Asian | 90.68 % 2016 | |
| Race – Black or African American | 76.77% 2016 | |
| Race – Native Hawaiian or Other Pacific Islander | 88.24% 2016 | |
| Race – White | 87.29% 2016 |
The measurements of progress are based on increases in the percentage of all students in Maine who make progress toward the long-term goals on a three-year basis. Long-term goals were developed to reduce the percentage of non-graduating students to result in student groups all meeting the goal of 90% by 2030. The calculation process, for example, is as follows:
Subgroup: All Students
- Step 1: 2016 Graduation Rate = 86.83%
- Step 2: 90% (goal) – 86.83% (baseline) = 3.17%
- Step 3: Differential for each 3-year step is 3.17 divided by 5 = .61%
- Step 4: Add to the baseline .61 % and add the .61% to each subsequent step to reach the goal of 90% by 2030.
Goals for extended- year cohort graduation rate
| Subgroup | Baseline (Data and Year) | Long-term Goal (Data and Year) 2030 |
| All students | 88.61% 2016 | 92% or maintain current 2016, whichever is greater, graduation percentages by 2030 |
| Economically disadvantaged students | 80.82% 2016 | |
| Children with disabilities | 77.27% 2016 | |
| English learners | 86.12% 2016 | |
| Asian | 94.27% 2016 | |
| American Indian | 83.49% 2016 | |
| Black | 83.47% 2016 | |
| Hispanic | 84.13% 2016 | |
| Native Hawaiian | 93.33% 2016 | |
| White | 88.84% 2016 | |
| Multiple Races | 86.62% 2016 |
Graduation rate will be presented on the initial page of the report card in the following way:


For further information please contact Janette Kirk, Acting Director, Office of Learning Systems at Janette.Kirk@maine.gov.
